#ReliefPH Aid Monitoring: $16,629,654 in Relief Disbursed to Date by Philippine Government
#ReliefPH, which is associated with #MovePH and Rappler.com, is maintaining a very helpful Google Document which you can view here . The spreadsheet (actually 9 spreadsheets, one each for Leyte, Eastern Samar, Western Samar, Biliran, Cebu, Aklan, Antique, Capiz, Iloilo, and Palawan) tracks the status of relief efforts on a Province by Province, Municipality by Municipality basis. It includes things like the amount of money released by DWPH, amount released by other agencies, number of families in evacuation centers, and number of homes damaged. Kudos to them for doing this. The figures in their spreadsheet are from NDRRMC and are being updated every day or two — with the earlier figures still there so you can see the progress.
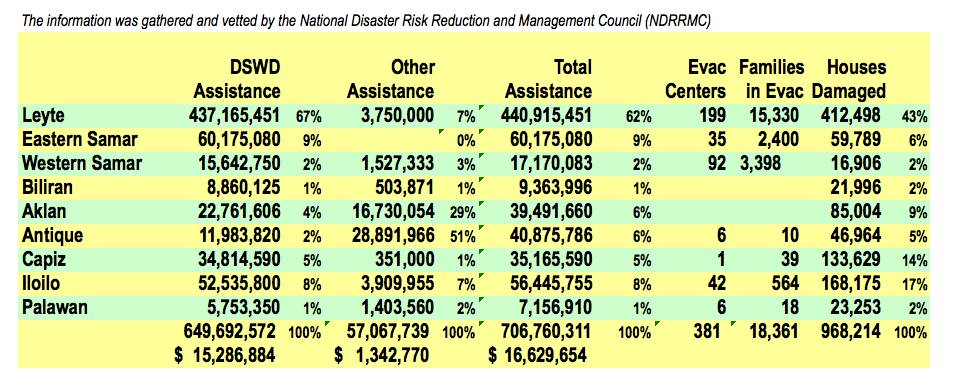
I just spent a couple of hours going through the spreadsheet, extracting from it information which I have consolidated into a single “topsheet” that just shows a few key indicators for each province. You can “drill down” much deeper into the information by going and viewing the full batch of 9 spreadsheets. But sometimes building up from the detail to a topsheet provides useful insights, and that is what I have done.
Obviously, this is very useful information for anyone trying to get a handle on the flow of relief assistance and the status of efforts. It answers some questions, and raises some others.
Following are the observations that come to mind as I look at it:
- When they talk about “damaged houses” — what about “destroyed houses”? Does this figure represent both damaged and destroyed? I would think so, but I noticed that President PNoy was making a distinction between damaged-but-recoverable homes, who would be given priority for rebuilding materials, and destroyed homes — which would not. (There was also discussion about not allowing people to rebuild in the same place if their home was too close to the ocean.) So I’m not sure whether these figures reflect destroyed homes as well as damaged ones. (When you go down and see the figures for Lawaan below, I have some further thoughts on this.)
- $16,629,654 in aid five weeks after the storm hit is really not very much. Spread across an affected population of 11 Million (government figures), that works out to a little more than $1.50 or P60 per affected person.
- Leyte, which we all know was really devastated and has come in for the lion’s share of attention in both the media and from aid groups, accounts for 43% of the damaged houses and has received 67% of DWSD assistance and 62% of assistance overall. This is understandable, but it points to the fact that the preponderance of aid is going to Leyte, perhaps out of proportion to its share of the calamity.
- Capiz has 14% of the damaged houses, but has gotten only 5% of the aid.
- Iloilo has 17% of the damaged houses, but has gotten only 8% of the aid.
- Antique has only 5% of the damaged houses and has gotten 5% of the aid — but look at their share of the “other assistance”. They have gotten 51% of all non-DSWD assistance. I wonder how that happened, and what the story is behind that?
If you go to the #ReliefPH google doc, you can look up individual municipalities and learn more about precisely what has gone to each municipality.
Here are some figures for our home municipality of Lawaan and neighboring municipalities of Balangiga and Giporlos.
A few comments:
- If the figures are taken at face value, it would seem that Lawaan is getting a disproportionate amount of the aid. According to this, the government has spent P1,732 per affected person in Lawaan as compared to P500 per affected person in Balangiga and P340 per affected person in Giporlos. Can this possibly be right?
- One reason it may not be right is that the population of Lawaan is 11,500 and it seems highly unlikely that 6,000 of those are unaffected. Most reports indicate that 95% of all structures in Lawaan were badly damaged or destroyed. So that figure of only 4,470 affected seems highly suspect. Giporlos’ population is 12,040, and Balangiga population is 12,740. It seems unlikely that, given the similarity in population and location, that Lawaan would have so many fewer affected.
Conclusion
I’m not sure there is one. But I am grateful to #ReliefPH for keeping the spreadsheet and making it available. Thank you guys.
Here is the 2010 Census for Eastern Visayas, which is helpful to have handy when reviewing this. http://www.census.gov.ph/sites/default/files/attachments/hsd/pressrelease/Eastern%20Visayas.pdf
One Response to #ReliefPH Aid Monitoring: $16,629,654 in Relief Disbursed to Date by Philippine Government
Leave a Reply Cancel reply
Year of the Spy Book Trailer
Video PlayerAbove is the Year of the Spy Book Trailer — for my upcoming non-fiction book about espionage upheavals on the streets of Moscow in 1985.
Below is a “trailer” showcasing the writing and video services I provide to clients.
Michael Sellers — Writing and Video Services
Video Player
My eBook — Just released Dec 5, 2012
EBook You don't need a Kindle or iPad -- Download Adobe Digital Editions for Free, then read the .mobi (Kindle Format) or .epub (Nook, iPad Format) digital book on your computer. Or order the PDF which is formatted exactly like the print book.Recent Posts
- Arsha Sellers — Today I’m One Big Step Closer to Becoming a Real Forever Dad
- Meet Abby Sellers and Arshavin Sellers — My Wife, My Son, My Inspiration Every Day
- What the Mueller Report Actually Says
- Remembering James Blount, an American Who “Got” the Philippines in 1901
- America the Beautiful? You Mean America the Pitiful. I Am Ashamed


After his death, the business was successfully carried on by
his three sons. Thread and stitching – thread used in stitching is always
the same as the colour of the leather. Wearing an elegant UGG boot with tight
jeans can give you a classy and beautiful look.